Statistical Process Control Charts
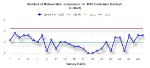
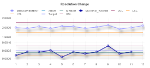
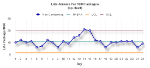
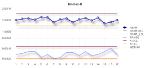
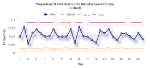
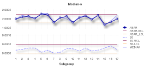
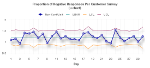
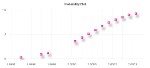
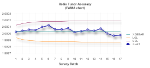
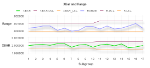
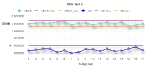
SPC, or Statistical Process Control, is a method for determining when the variation in a given business process has exceeded “normal” behavior and is considered “out of control”. SPC calculations are applied to raw data, and the results are then graphed for easy viewing. Once identified, out of control processes can command the appropriate level of management’s time and attention, and strategies can be devised to address them. NetCharts Server and NetCharts Designer include a library on functions that can be used to create the following SPC charts.
img/chart-c.png SPC Attributes Chart - c
img/chart-mr.png SPC Attributes Chart - MR
img/chart-np.png SPC Attributes Chart - np
img/chart-median-r.png SPC Attributes Chart - Median-R
img/chart-p.png SPC Attributes Chart - p
img/chart-median-s.png SPC Attributes Chart - Median-s
img/chart-u.png SPC Attributes Chart - u
img/chart-probability.png SPC Attributes Chart - Probability
img/chart-ewma.pngSPC Attributes Chart - EWMA
img/chart-xbar-r.png SPC Attributes Chart - XBar-R
img/chart-xbar-s.png SPC Attributes Chart - XBar-s img/blank.pngimg/blank.png